|
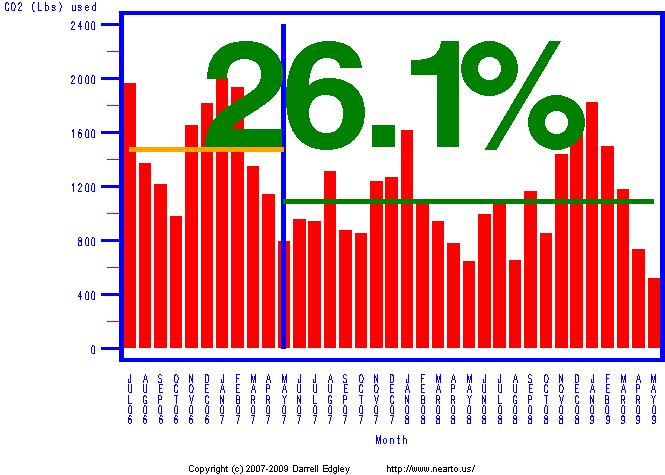
Our CO2 pollution is shown in the following plot. The vertical blue line indicates the date of 24MAY2007 which was when we made a significant change in our habits or installed a solution, for details see below.
The value of 26.1% indicates the percentage change after our improvement. The horizontal lines indicate the MEAN (average) use, before then AFTER the improvement.
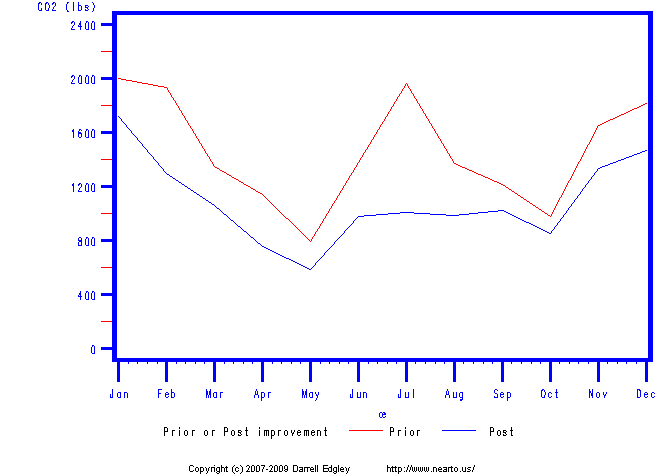
The following plot shows month by month AVERAGE use prior to and since 24MAY2007 which is when we improved our solution within our home.
| 


