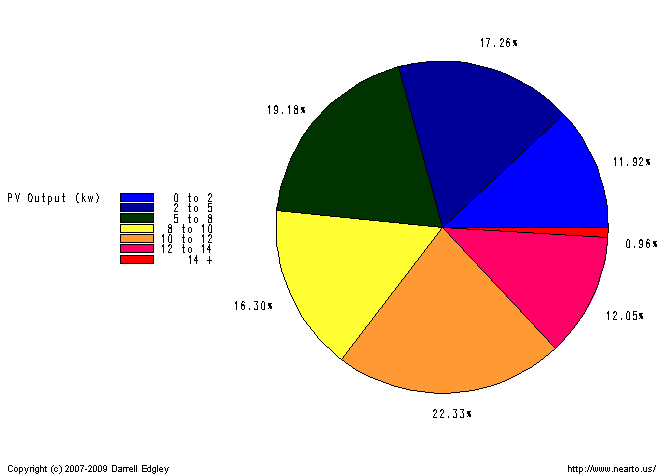
Photo Voltaic PV Data Collection and Plots
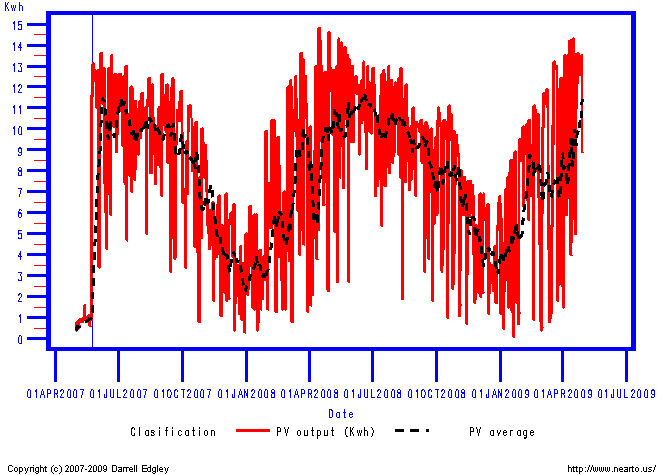
Our PV Panels were installed on 1st May 2007, but not fully installed and configured to the local Electricity Grid until 24th May 2007 (represented
by the vertical blue line). During the first three weeks, the PV output reflects purely the power we drew directly from the PV Panels while they were generating electricity, our typical load during the day is low.
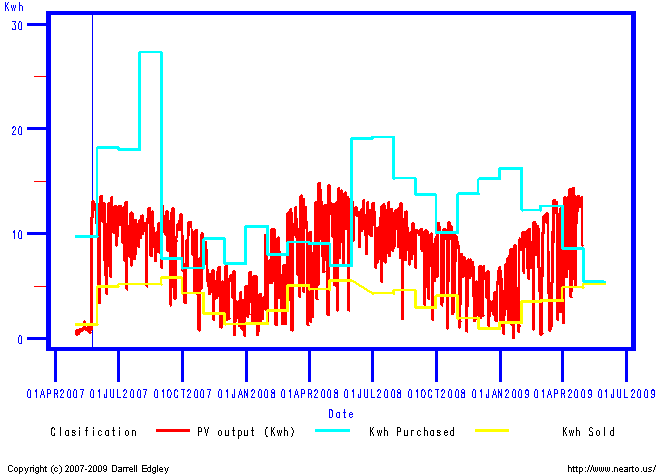
We also observe significant variability in the PV output per day, no two days are alike. The plot below shows the actual data in red and average readings of 14 days to smooth the plot line in black dashes.
Our full solar data which icludes details of our PV and Hot Water systems details the actual daily values.
| Month | Mean daily PV | Minimum
daily value | Maximum
daily value | Number of
readings | Standard
Deviation |
| Early MAY2007 | 0.8478 | 0.4 | 1.6 | 23 | 0.2428 |
| Late MAY2007 |
12.2375 | 11.0 | 13.1 | 8 | 0.7347 |
| Total for all of MAY2007 |
3.7871 | 0.4 | 13.1 | 31 | 5.0828 |
| JUN2007 | 10.2767 |
3.4 | 13.6 | 30 | 2.7793 |
| JUL2007 | 10.1677 | 4.7 |
13.0 | 31 | 1.9343 |
| AUG2007 | 10.0290 | 5.0 | 12.4 |
31 | 1.5315 |
| SEP2007 | 9.7333 | 3.2 | 12.6 | 30 |
2.6570 |
| OCT2007 | 7.3387 | 0.8 | 11.1 | 31 | 3.0816 |
|
NOV2007 | 5.1400 | 1.1 | 9.2 | 30 | 2.0636 |
| DEC2007 | 3.1290
| 0.3 | 6.9 | 31 | 1.8652 |
| JAN2008 | 3.5161 | 0.4 |
9.9 | 31 | 1.9472 |
| FEB2008 | 5.1414 | 1.3 | 10.4 |
29 | 2.5745 |
| MAR2008 | 8.7645 | 0.8 | 13.6 | 31 |
3.8948 |
| APR2008 | 8.6033 | 1.6 | 14.8 | 30 | 4.1907 |
| MAY2008 | 10.4903 | 2.7 | 14.3 | 31 | 3.1881 |
| JUN2008 |
11.2167 | 8.1 | 13.2 | 30 | 1.2951 |
| JUL2008 | 10.1032 |
5.4 | 13.0 | 31 | 2.1176 |
| AUG2008 | 9.7710 | 1.9 |
12.9 | 31 | 2.2025 |
| SEP2008 | 8.3533 | 1.8 | 10.4 |
30 | 2.3938 |
| OCT2008 | 7.9323 | 1.0 | 11.1 | 31 |
3.1090 |
| NOV2008 | 5.2067 | 0.7 | 8.8 | 30 | 2.5075 |
| DEC2008 | 3.9129 | 1.2 | 6.9 | 31 | 1.8284 |
| JAN2009 |
4.7097 | 0.1 | 9.5 | 31 | 3.0940 |
| FEB2009 | 8.0679 |
0.8 | 11.1 | 28 | 2.6512 |
| MAR2009 | 7.5871 | 0.4 |
13.2 | 31 | 4.7864 |
| APR2009 | 9.9448 | 1.5 | 14.3 |
29 | 3.9228 |
| Summary of all PV data | 7.6133 | 0.1 | 14.8 |
730 | 3.8699 |
Summary of PV data since 24th May 2007
(Date system fully configured) | 7.8334 | 0.1 | 14.8
| 707 | 3.7313 |
Our PV System is Grid Tied with battery backup. Our meters do not directley tell us what we consume in terms of power per day. The items we do
know are:
- The output from our PV system on a daily basis
- How many units of power (in kwh) we purchased from the local grid (monthly basis from utility bill)
- How many units of power (in kwh) we sold to the grid (monthly basis from utility bill)
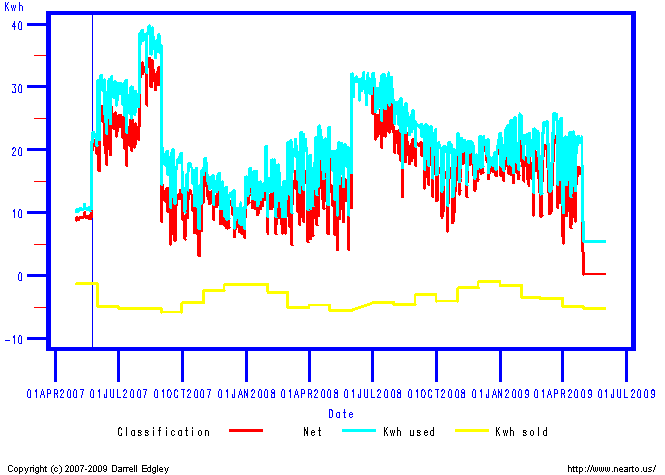
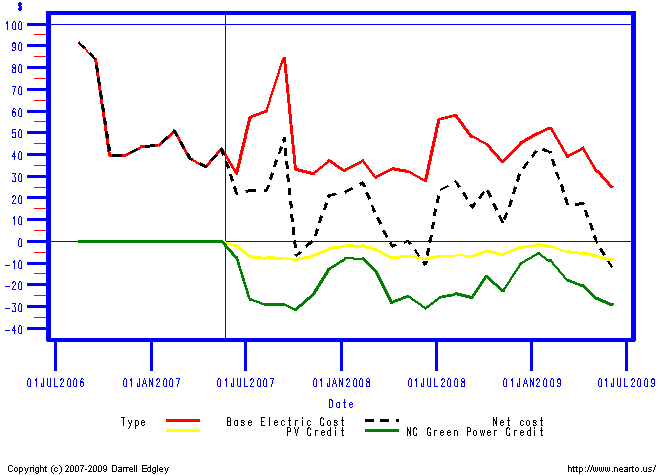
From these numbers we can work out our consumption and our net cost of electricity per month.
As our utility bills are monthly, the plots look like "step plots", so these have been smoothed with rolling averages over a 14 day period.
Our electrical costs since moving in to the home are:
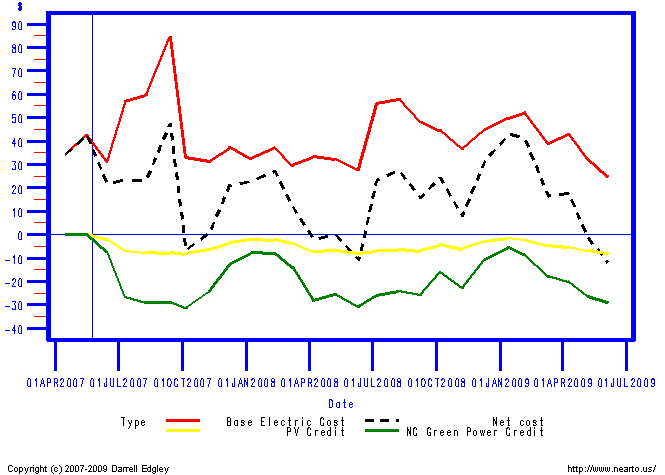
The impact of our PV system is:
Daily PV output:

